
The limitation of FTP-Based Training Zones
For the past two decades, Functional Threshold Power (FTP) has become the foundation of power-based training in cycling. Complete an FTP test, calculate your threshold power, and training software automatically generates a set of training zones based on percentages of that value.
It's simple, convenient, and effective for many riders.
But there is a significant limitation that often gets overlooked: FTP-based zones assume that every rider's physiological profile is broadly similar.
The reality is far more complex.
The Assumption Behind FTP Zones
Most power-based training systems prescribe zones as fixed percentages of FTP. For example:
Zone 2/Endurance: 56-75% of FTP
Zone 3/Tempo: 76-90% of FTP
Zone 4/threshold: 91-105% of FTP
Zone 5/VO2 Max: 106-120% of FTP
The underlying assumption is that if two riders have the same FTP, their endurance capacity, lactate responses, and high-intensity capabilities will occur at similar percentages of that FTP.
In practice, this is rarely the case.
FTP is only one point on an athlete's physiological profile. It tells us something important about sustained aerobic performance, but it doesn't reveal how that athlete performs below or above threshold.
The Impact of a Larger Anaerobic Capacity
One of the biggest differences between athletes is their anaerobic capacity.
Some athletes possess a much larger anaerobic capacity than others. These riders can repeatedly produce high power outputs well above threshold and tolerate efforts at a greater percentage of FTP.
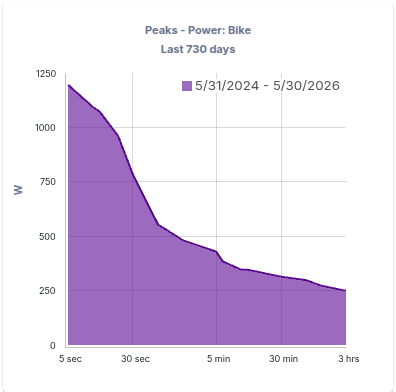
A graph demonstrating an athlete with larger anaerobic capacity
For example, two cyclists with identical FTP values may have vastly different abilities to complete VO2 max intervals:
One rider may comfortably complete intervals at 120% of FTP.
Another may struggle to sustain 110% of FTP for the same prescribed duration.
The difference is not necessarily fitness. It is often a reflection of how their physiology is built.
Athletes with a larger anaerobic contribution can generate more power above threshold, while highly aerobic athletes may have less ability to produce short-duration power despite having excellent endurance performance.
This means that prescribing VO2 max or anaerobic intervals purely as a percentage of FTP can produce very different physiological stimuli between riders.
Not Everyone Has the Same Zone 2
Differences also occur when working at intensities below threshold.
Some riders can comfortably ride at 75% of FTP for hours while maintaining low lactate levels, stable heart rates, and manageable perceived effort. Others may find that the upper end of the traditional Zone 2 range pushes above the optimal intensity.
Consider two riders with an FTP of 300 watts:
Rider A may be able to ride at 220 watts for several hours while remaining comfortably aerobic.
Rider B may find that 220 watts produces excessive fatigue and elevated heart rates, despite it being the same percentage of FTP.
Using the same FTP-derived Zone 2 prescription for both athletes ignores these individual differences.
As a result, some athletes may be under-training their aerobic system, while others may be unintentionally turning endurance rides into moderate-intensity sessions that generate excessive fatigue.
The Solution? Consider Heart Rate and RPE
The rise of power meters has provided cyclists with an incredibly valuable training tool, but power should not be viewed in isolation.
Heart rate and Rating of Perceived Exertion (RPE) provide important context that power alone cannot capture.
When completing endurance rides, ask questions such as:
Is my heart rate remaining stable?
Am I able to maintain conversation comfortably?
Does this effort feel sustainable for several hours?
Similarly, during higher-intensity sessions:
Am I reaching the intended level of exertion?
Is my heart rate responding as expected?
Can I complete all intervals with consistent quality?
If the prescribed power target consistently feels too easy or too difficult, it may indicate that your FTP-derived zones are not accurately reflecting your physiology.
Power tells you what you are doing. Heart rate and RPE help explain how your body is responding.
The most effective training combines all three metrics.
Lactate Testing Provides Greater Precision
For athletes seeking greater accuracy, lactate testing can offer valuable insight.
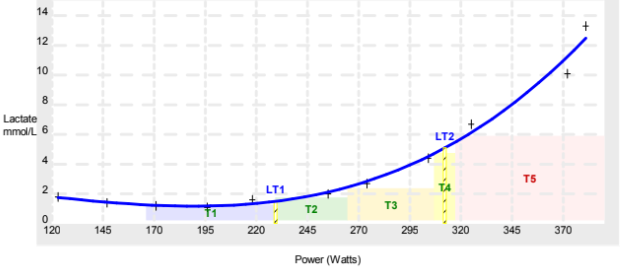
A graph showing lactate relative to power training zones
Rather than assuming training zones occur at standard percentages of FTP, lactate testing measures how an athlete's physiology actually responds to increasing workloads.
This can help identify:
Aerobic thresholds
Lactate thresholds
Individual endurance zones
Appropriate tempo and threshold intensities
Many athletes discover that their true endurance zone is either significantly higher or lower than traditional FTP percentage models suggest.
Because lactate testing measures physiological response directly, it can provide a more individualized framework for training, particularly for athletes focused on maximizing endurance performance.
FTP Is a Starting Point, Not the Final Answer
None of this means FTP is useless.
FTP remains one of the most practical and valuable metrics available to cyclists. It provides a useful benchmark for tracking progress and building structured training plans.
The problem arises when FTP is treated as the sole determinant of training intensity.
Every athlete has a unique physiological profile. Some have a larger aerobic engine and can ride harder during endurance sessions. Others possess greater anaerobic capacity and can perform high-intensity efforts at a higher percentage of threshold power.
The best coaches and athletes recognise that training zones should not be determined by a single number alone.
Power, heart rate, RPE, and where possible lactate testing should all be considered together. By combining these tools, cyclists can move beyond generic percentage-based zones and build training that is truly individualised to their physiology.
Ultimately, FTP is a useful starting point—but it should never be the end of the conversation.